
The last time I ran a short-term book sale — lowering the Kindle book price of Measures of Success: React Less, Lead Better, Improve More to $2.99 — I was curious what would happen.
I saw a short-term spike in book sales that was a “signal” as the “Process Behavior Charts” methodology would teach us. The higher sales were NOT a randomly-occurring event.
I could pretty confidently connect cause and effect — the lowering of the price caused the effect of increased sales. OK, that's basic microeconomics… but if I lowered the price and didn't attract more readers, I would learn something. Maybe there's a limited appeal for this book at any price.
I blogged about the last pricing experiment and below you'll find part of a daily Process Behavior Chart of Amazon sales (which does co-mingle paperback and Kindle sales, which isn't ideal).
The red line is the “Upper Natural Process Limit” — the highest sales that would have been predicted by previous routine fluctuation around the average (the green line). The calculated “Lower Natural Process Limit” is a negative number here, so it's basically zero and not shown. Learn about the calculations here or in my book.

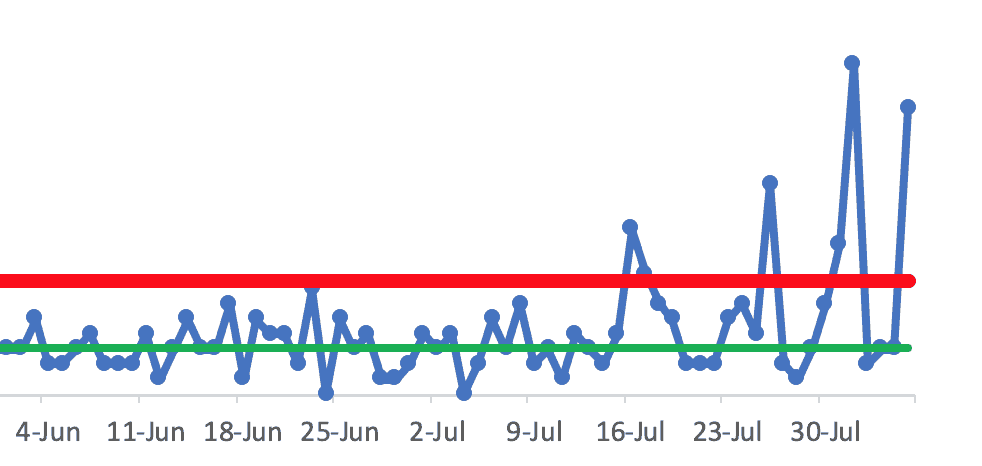
Below is the Process Behavior Chart that shows daily sales over a longer time frame from before the Kindle sale through the end of July:
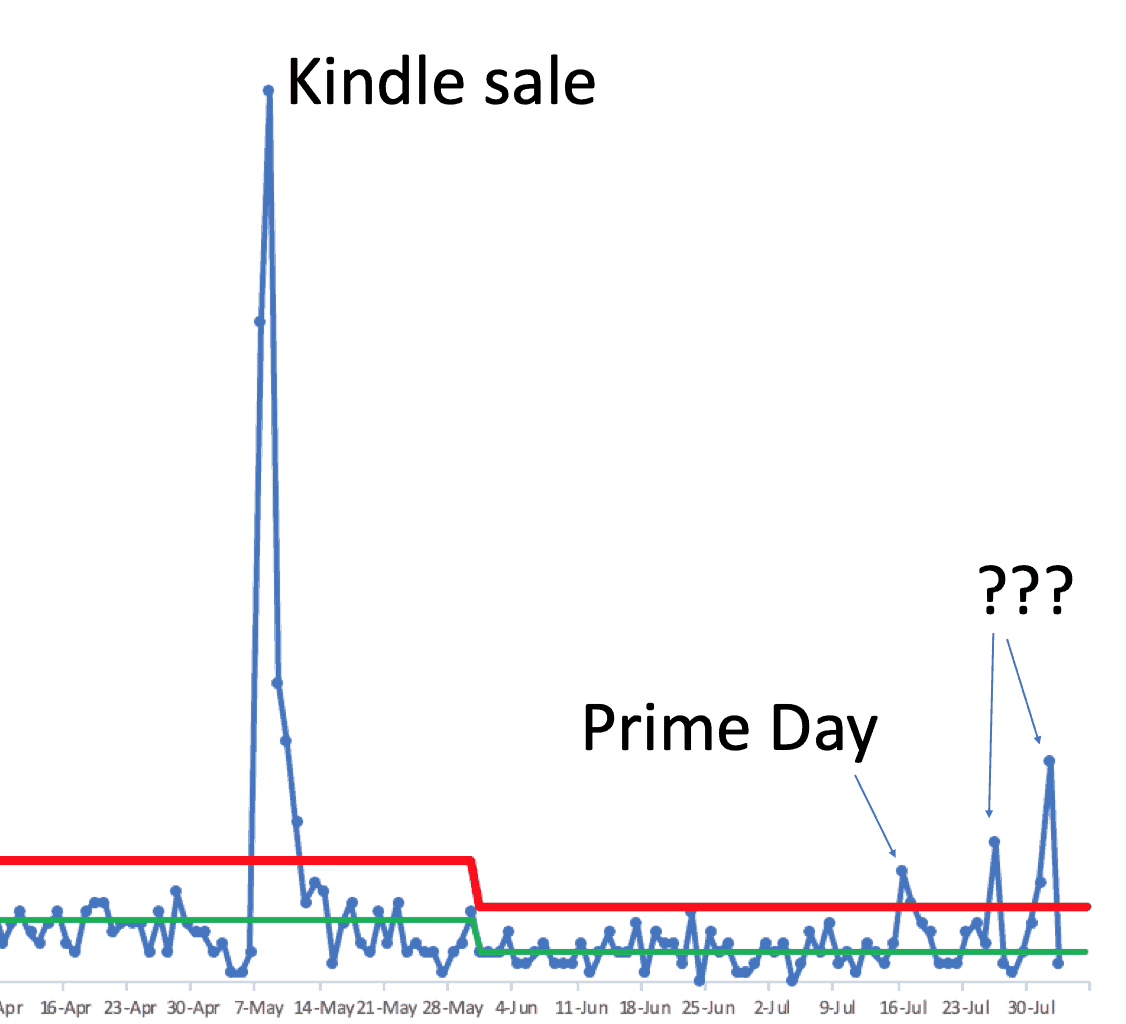
You can see the average sales dropped in June (evidenced by a “signal” of eight consecutive data points below the previous mean) and it was fluctuating predictably around an average for a while… until it wasn't. We see “signals” of days with sales that are above the Upper Limit.
So what was the cause of the “signal” that occurred on July 16? I'm quite certain that the cause was Amazon's “Prime Day” promotion that offered discounts on books (among many items).
What happened with the next two spikes in sales? I don't know what caused that. That's the thing, Process Behavior Charts will tell that something was different but you have to figure out what was different.
Did I do anything specific that was intended to boost sales? No. Did something happen that was unusual and not caused by me? Maybe.
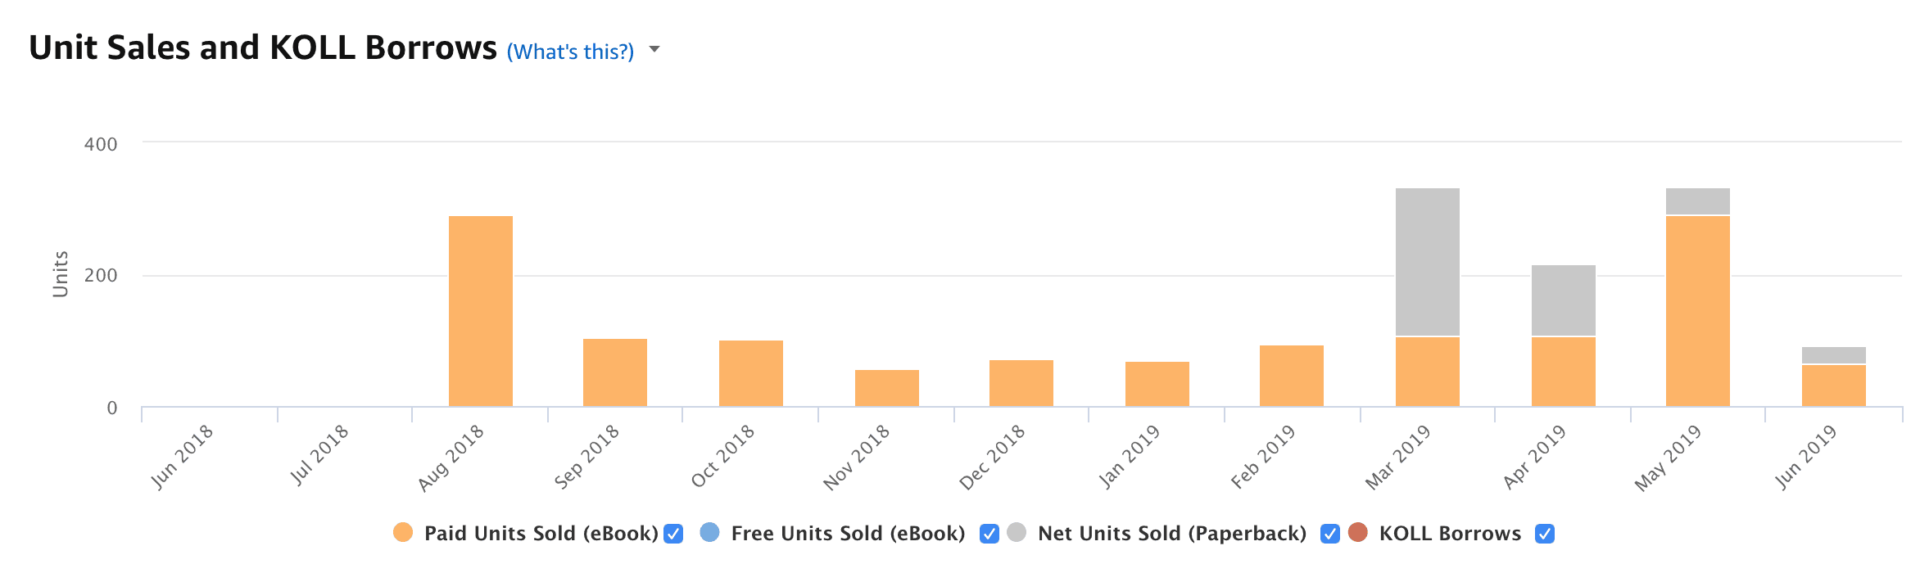
Amazon does show some data that breaks down paperback vs. Kindle sales (in a column chart, ugh). Yellow is Kindle and grey is paperback.
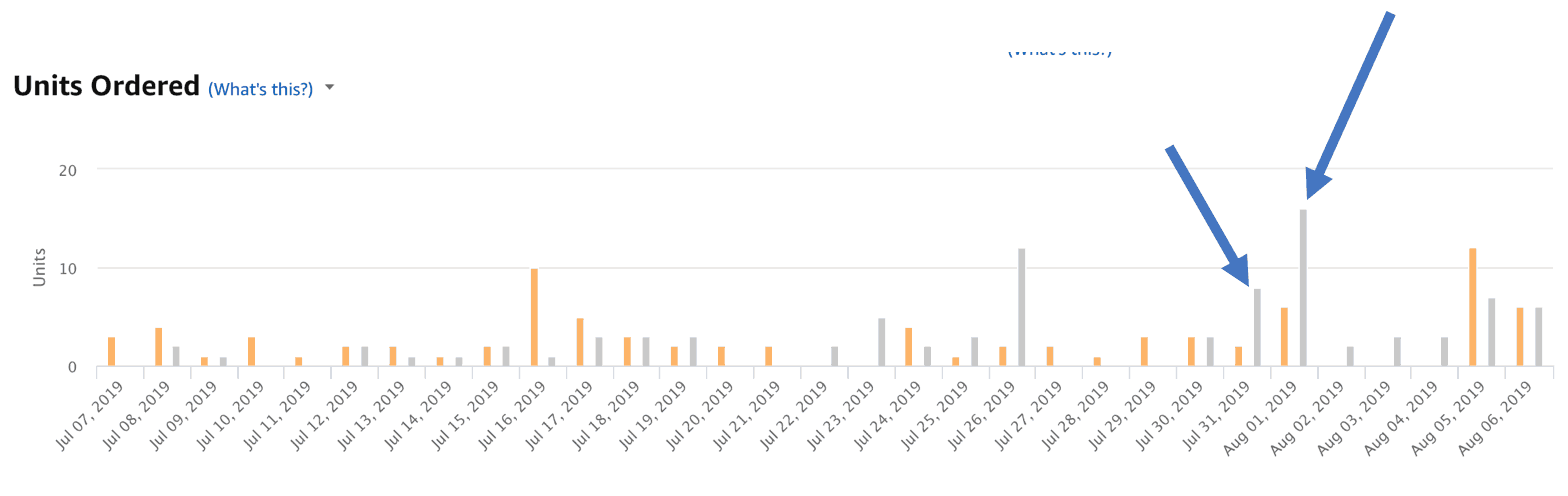
You can see that I had a spike in paperback sales on July 31 and August 1. There was another spike on July 26 — these were all “signals” on the PBC. Maybe somebody made a bulk order of paperbacks. Usually, the Kindle book outsells the printed version.
Note: If you want to do a bulk order, I can offer you a better price as the publisher and I can even offer signed copies.
When I taught my workshop at Cleveland Clinic last Friday, somebody asked a very good question — a few questions. They asked what I had learned from my PBC about book sales. They asked if I had gotten a spike in orders from running a sale, could I duplicated the experiment.
So, I'm doing that!
When I ran the sale in May, I had dropped the price from $9.99 to $2.99. I promoted it through social media, my blog, and my email newsletter.
This time, I am dropping the price from $5.99 (the price that Amazon claims is profit-maximizing) to $2.99. I posted on social media. Now, I'm writing a blog post and I'm going to promote the sale in my newsletter.
Will I get the same spike?
Monday, the first full day with the lower price had a spike (a “signal” in the PBC).
Here is Amazon's run chart format:
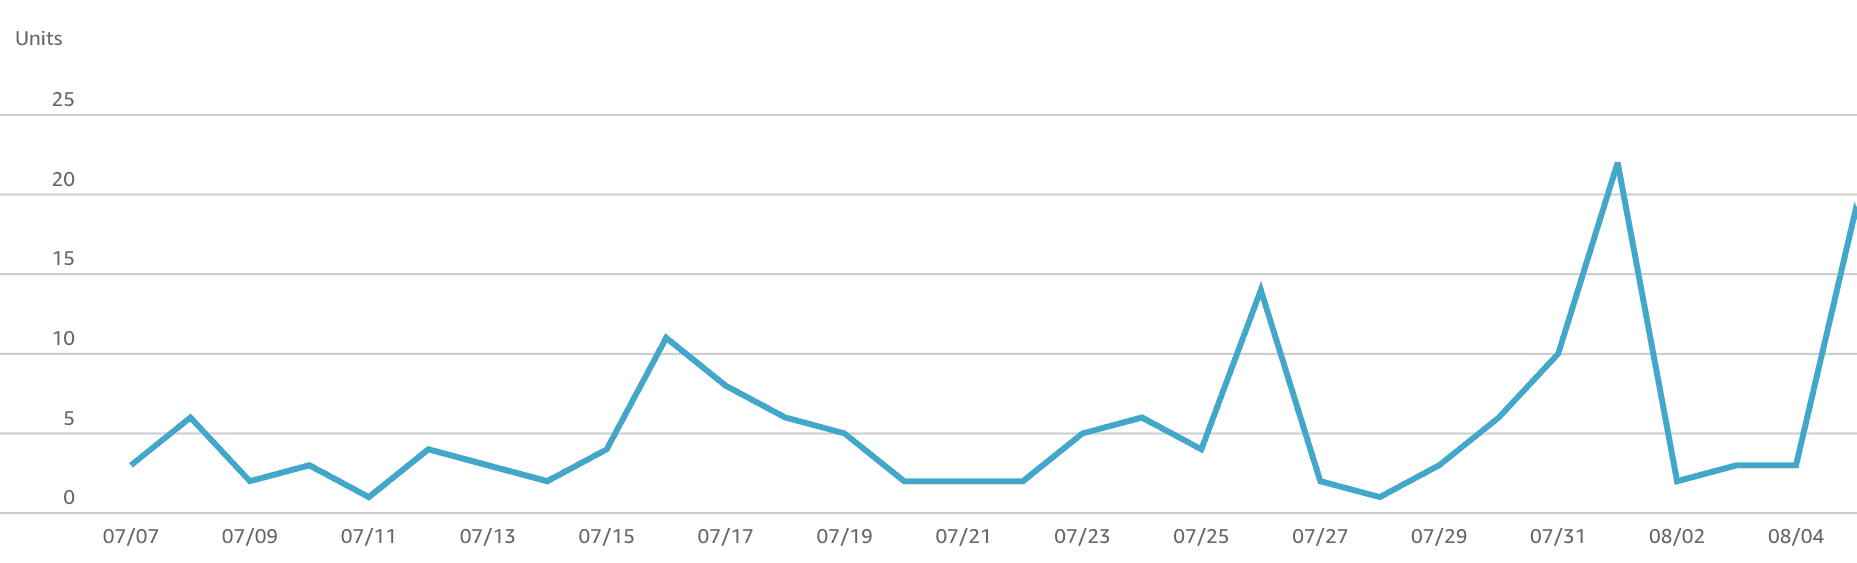
The spike — the last data point there — isn't as high as the spike was in May. The spike then was 89 books. This time it was 19.
If I dig deeper, interestingly, Amazon tells me that I sold 12 Kindle books and 7 paperbacks. The recent Upper Limit of my PBC is 7.5, so the paperback sales alone were above average and nearly a signal.
Maybe promoting the Kindle book led to some choosing to buy the paperback?
I should maybe do two separate PBCs — one for Kindle sales and one for paperback sales. I never look that closely at Apple Books sales, but maybe I should.
Here's the partial Process Behavior Chart up through yesterday with my I-think-it's-discount-fueled spike in that last data point.
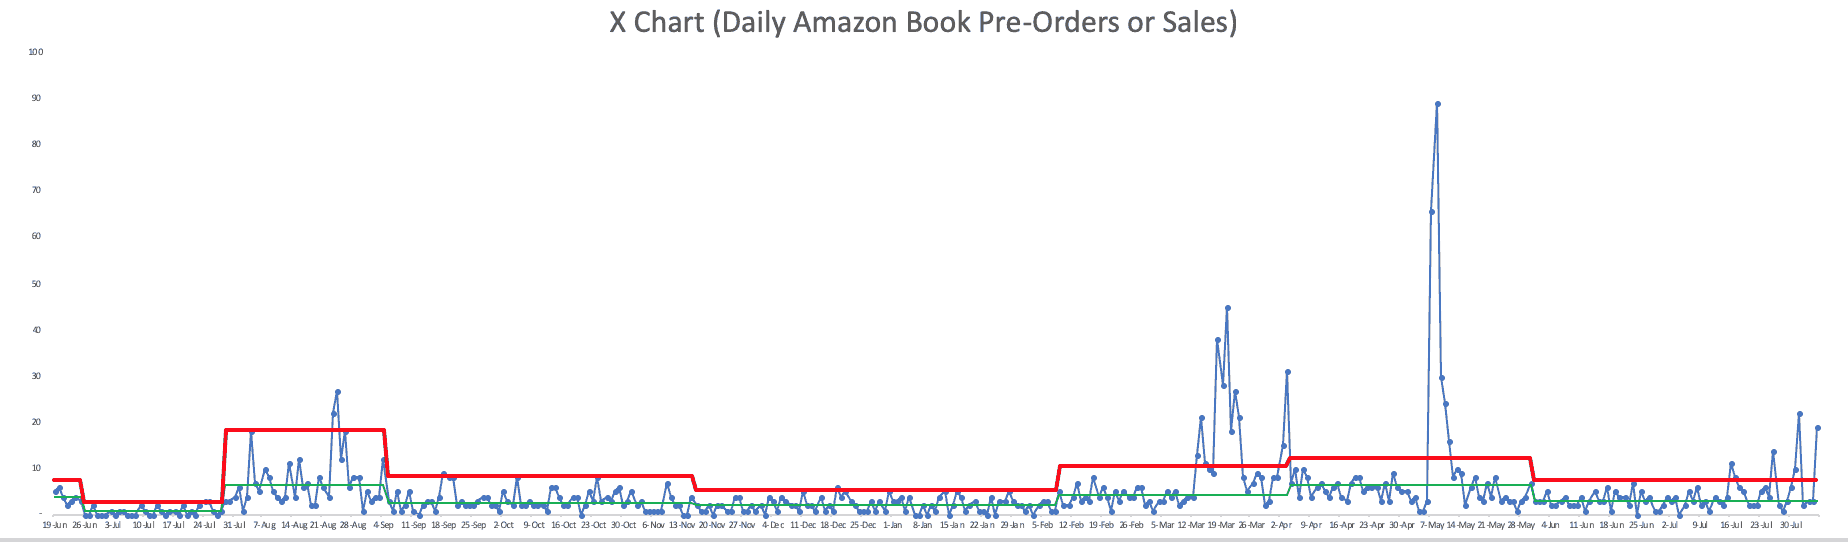
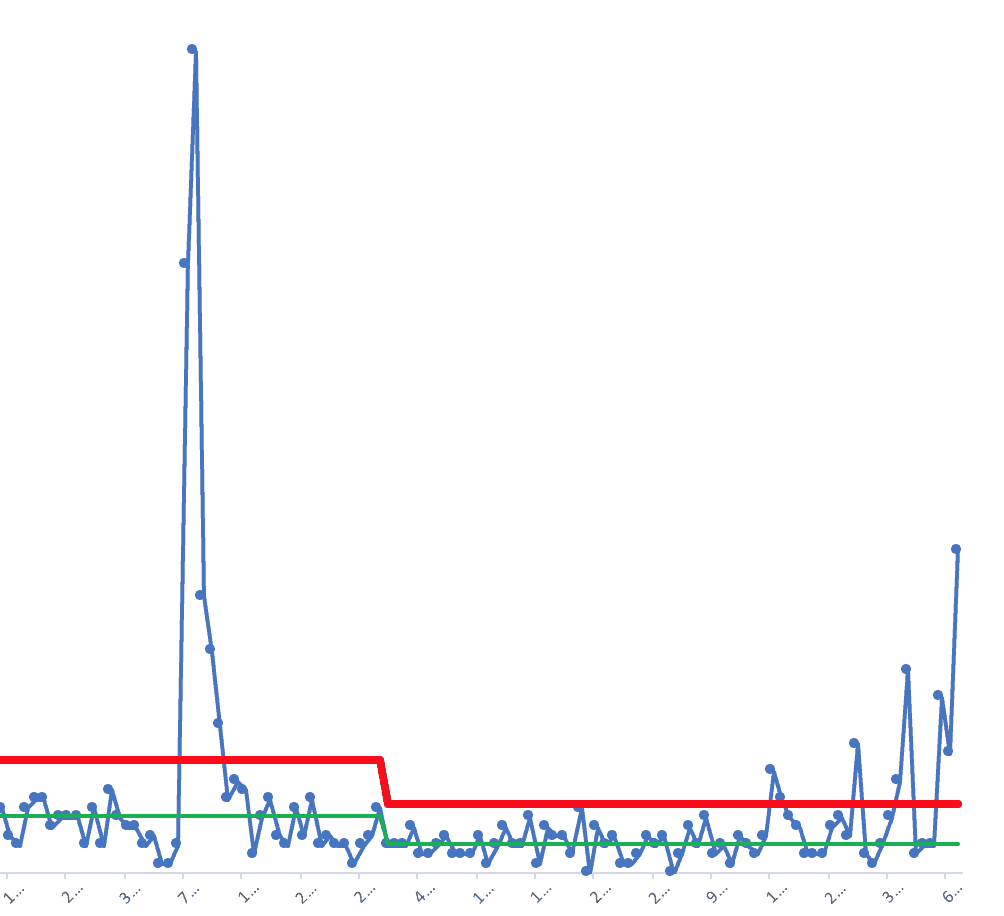
Below is my full PBC with ALL daily data over time, which is too much to take in — it's been just over a year since I released the Kindle version.
Here is Amazon's monthly history chart (again, I don't like column charts for time series data) — Kindle in Orange and paperback in grey.
Here is a Process Behavior Chart showing weekly data and what I think are the causes of shifts over time — due to things I've done and things that just happened:
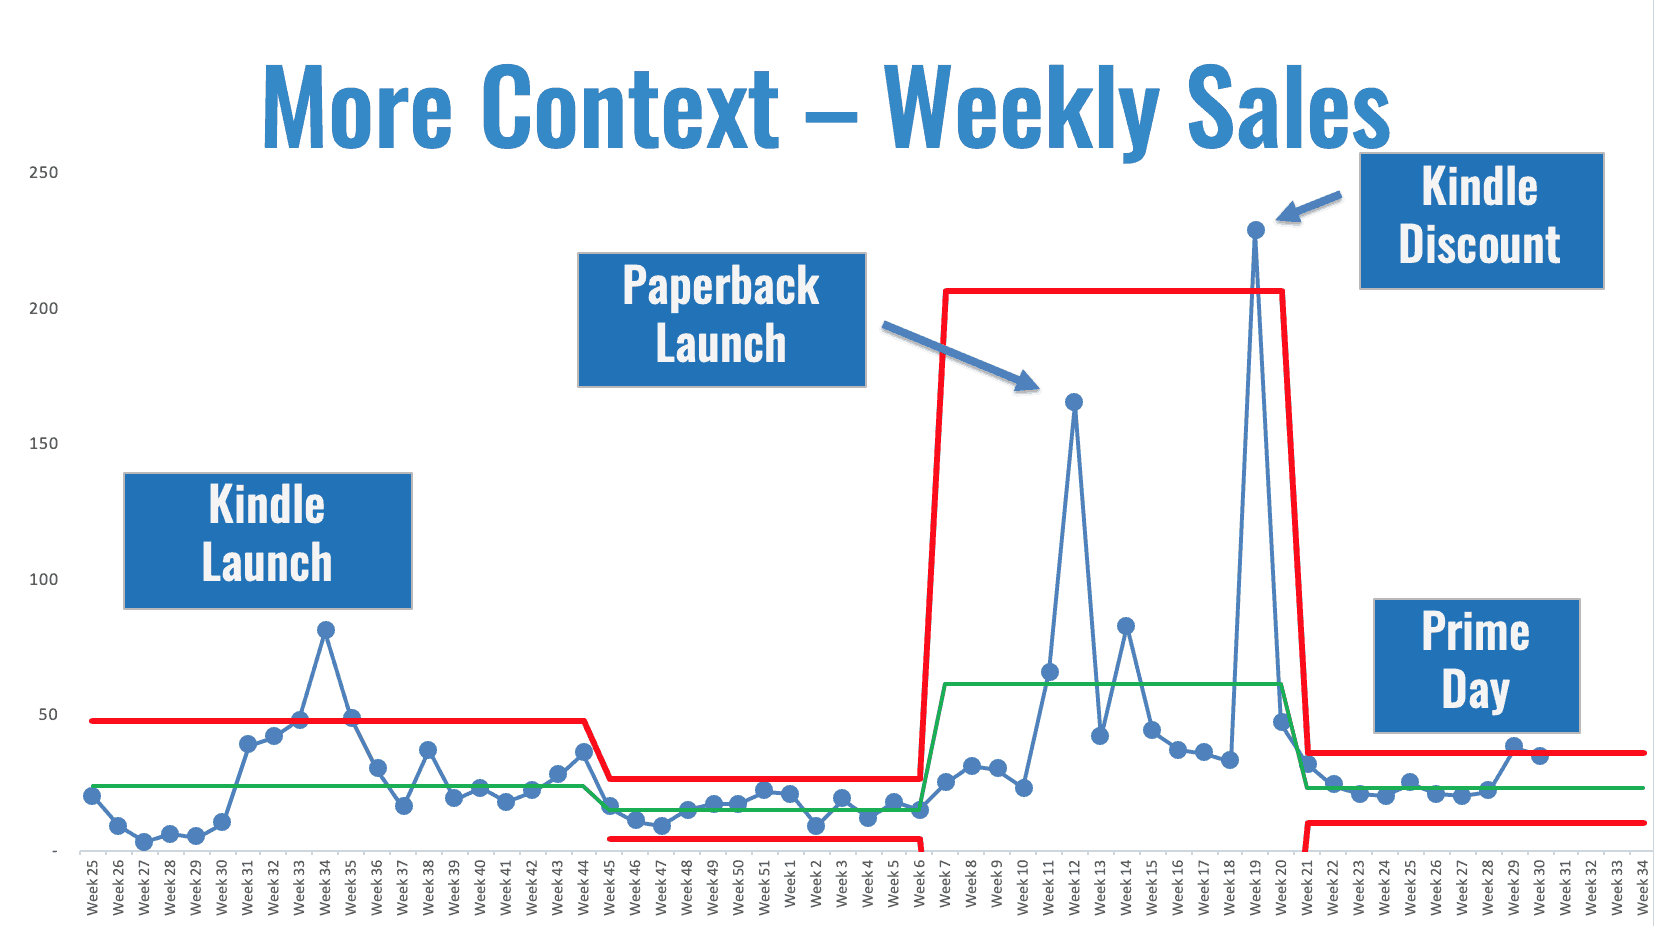
This chart, until recent spikes, would let me predict that I'd sell between 10 and 36 books each week (the Lower Natural Process Limit is shown above when it's not negative).
Beyond tweaking the price, there are other things I can do to improve the “system” generates book sales. The point of Process Behavior Charts isn't just to make charts — they help us learn, they help us connect cause-and-effect, and they help us evaluate changes and improvements.
I'll update this post as I get more days of data during the sale (which I might end on Friday).
Sales Data Update
Below, you'll see the last data points show a spike in sales with this latest promotion. The peak (35 books yesterday) is not as high as the peak in May.
Free Webinar for Authors [Recording]
I also presented a webinar on Friday that was hosted by my fantastic book coach, Cathy Fyock. It was free and open to the public, especially authors who want to look at their data in a new and better way.
Here is the recording:
Thanks for checking it out…
What do you think? Please scroll down (or click) to post a comment. Or please share the post with your thoughts on LinkedIn – and follow me or connect with me there.
Did you like this post? Make sure you don't miss a post or podcast — Subscribe to get notified about posts via email daily or weekly.
Check out my latest book, The Mistakes That Make Us: Cultivating a Culture of Learning and Innovation:


I can tell you that I “fell” for your current Kindle promotion – bought it on Aug 5th. Even though I would have preferred the paperback, the price was too good to pass up… Looking forward to reading it.
Thanks, Will! I hope the book is helpful. If you want the paperback, you can get it cheaper directly through me than you can through Amazon, if you decide to go that route.
If a reader out there already purchased the paperback from Amazon, you can get the Kindle version for just 99 cents through their “Matchbook” program.
I’ve updated the post — there’s been a spike in sales, but not as high as the spike in May…