Tag: Process Behavior Charts
Stop Overreacting to Metrics: Lessons from Lean Startup Week
Thanks to Eric Ries and the organizers for Lean Startup Week for allowing me to share video of my 15-minute talk from last year's event.
One reason for sharing this today is to celebrate yesterday's initial release of the in-progress version of my book Measures of Success. If you buy the book now, you'll get a PDF of the first three chapters, or about 40% of the book's expected content.
My Talk in Vegas: Leadership Lessons from Statistics and Psychology
Today, I’m giving a keynote talk at the Lean & Six Sigma World Conference being held in Las Vegas. I don’t normally attend or speak at “Lean Sigma” events, but I had an opportunity to give a new talk that touches on two of my favorite themes in recent years – the need to apply statistics and psychology to our “Lean Management” practices or Six Sigma or whatever.
Are Minor League Baseball Games Getting Slower or Faster?
Are minor league games taking longer? Well, yes and no, depending on the league.
My next book, Measures of Success, is about the use of this Process Behavior Chart methodology in the workplace, as applied to our performance measures.
This post explores some data, how asking for more data can be more helpful, and how to use charts to evaluate a metric over time.
Ratings for “The Oscars” Were Lower in 2018? Should We Ask...
As I blogged about yesterday, things went well at the Oscars... or, at least, no errors were made in the announcements. But that thing that didn't go well was the TV ratings.
Two Data Points Are Not a Trend
The headlines I saw had a lot of two-data-point comparisons. Headlines sometimes gave the percentage decrease in viewers or how many million fewer viewers there were. Many talked about "record low" but if you're tracking a metric "record low" or "all-time high" doesn't mean there's a "special cause." That "record low" could still be noise in the system.
Every Metric Has Variation – What Can We Learn from NCAA...
Last week, I saw a headline about a drop in NCAA college football attendance.
I wasn't satisfied with the two data point comparisons or other written descriptions of the metrics. I wanted to see data. SHOW ME THE DATA, JERRY! (with apologies to "Jerry Maguire"). I wanted to see a chart. So, I found the data on to NCAA website and created "process behavior charts" that tell you much more about the data than text numbers ever could.
Two Data Points Don’t Make a Trend, So Read Beyond the...
When looking at data, whether it's the number of homicides in San Antonio or some of our workplace metrics, it's tempting to overreact to a "headline" that says a measure went down in 2017 compared to 2016. But do two data points really help us understand what the real trend is? This blog post explores an approach we can use to make better decisions about our data.
How Champagne Corks Reveal Restaurant Dining Trends: A Simple Data Visualization...
Last month, my wife and I had a chance for a week's vacation in Europe. As I've blogged about before, we enjoy doing some form of "gemba walk," if you will, at wineries and distilleries. At one restaurant, I was surprised to find a "chart" of sorts in the form of champagne and wine corks...
Visualizing Metrics & Managing Improvement Properly: Webinar Registration Numbers
When managing a process and looking at results, the type of chart we use matters. The way we react to the chart matters too. In this blog post, I explore two different types of charts and explain why I like the "process behavior chart" format better.
Is Andre Drummond a Better Free Throw Shooter This Season?
Today's blog post -- it's not just about sports, it's about managing and measuring improvement...
What Do the “The Toyota Way” Books Say About Visual Metrics?
As I've been writing about "process behavior charts" - a simple, yet effective method for charting and reacting to (or not overreacting to) metrics, it's made curious what some of the modern Toyota books say about metrics and performance measures.... or at least the first two in The Toyota Way series.
Deciphering the World Series Home Run Surge: A Data-Backed Analysis of...
If you watched this year's World Series, you saw a lot of home runs. There were many dramatic home runs in late innings or...
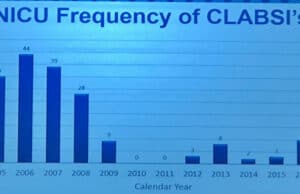
What Do We Learn From Charting a Reduction in CLABSI Rates...
I'm in San Francisco for Lean Startup Week. Please say hi if you're here! Follow hashtag #LeanStartupWeek for details the rest of the week....


