


“Every month, we're buried in data–and yet somehow, we're still arguing over whether there's actually a problem.”
That was the problem statement shared with me by a health system CEO–not at a conference, but during a quiet, off-the-record leadership retreat. The frustration in his voice was familiar. I've heard it from many executives across healthcare: well-intentioned leaders drowning in numbers but starving for actionable insight.
This isn't a “bad leadership” problem. It's a system problem. More precisely, it's a measurement system problem.
The Real Problem Isn't the Data–It's What We Do With It
The CEO went on:
“We were chasing ghosts. Everyone had their own interpretation of the metrics, and trust in the data–and in each other–was wearing thin.”
In most organizations, data is meant to drive improvement. But when that data lacks context–when we can't tell if a metric is behaving normally or not–we end up reacting to noise. We confuse routine variation for real change. We reward or punish people for things they didn't cause.
It's no wonder the leadership team at this health system was losing confidence–not just in the numbers, but in each other. As the CEO admitted:
“Before Process Behavior Charts, the meetings were filled with suspicion. We didn't know if the data was real or just a blip. It was exhausting.”
Introducing a Better Way to See and Lead
That's when we introduced Process Behavior Charts (PBCs)–a foundational tool from statistical process control that I teach in my book, Measures of Success. Unlike simple run charts or red-yellow-green dashboards, PBCs help you understand what your system is naturally doing, so you can distinguish between signal and noise.
This wasn't just about charts–it was about creating a more rational, trustworthy approach to data-driven leadership.
And the change was immediate.
“Process Behavior Charts brought us clarity. We no longer confuse variation for a problem–now we focus on signals that truly matter,” the CEO told me.
What Are Process Behavior Charts, Really?
Process Behavior Charts–or PBCs–aren't just another analytics tool. They're a mindset shift. A culture shift. A way to distinguish between what's routine variation and what's a meaningful signal. They allow leaders and teams to focus on what really matters.
When we introduced PBCs to this executive team, there was an initial moment of skepticism. These were smart people. Data-driven leaders. But as we walked through real examples using their own metrics–ER wait times, patient falls, lab turnaround times–something clicked.
“You're telling me we've been reacting to normal variation this whole time?” the CEO asked.
I didn't have to answer. The chart did. Here's what one of those charts would look like:
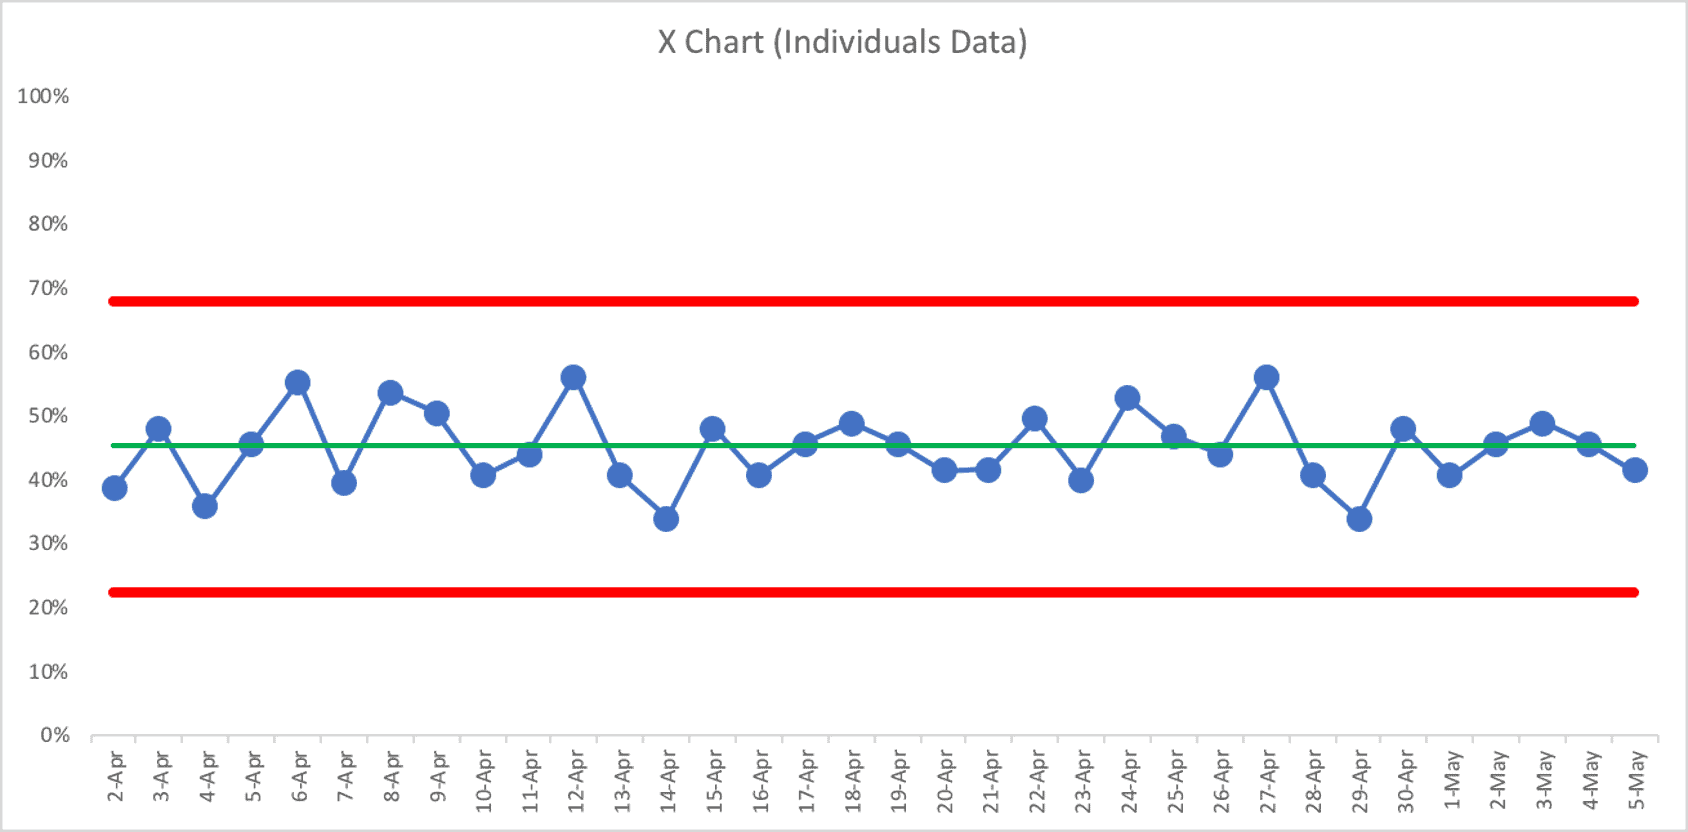
The Process Behavior Charts methodology teaches us that none of those data points are worth reacting to or explaining.
If we're not supposed to react to the ups and downs, what should we do?
Take a step back and work to improve the system… systematically. That's what works.
From Monthly Firefighting to Focused Improvement
The VP of Process Excellence at this organization put it another way:
“Before PBCs, we were having the same debates every month. Now, we spend our time improving instead of arguing about the data.”
That shift in mindset changed how leaders engaged with their teams. They stopped asking, “Why did this number go up?” every time a line moved. They started asking, “What does the chart tell us?” They learned to trust the system–and know when it needed to change.
One leader described it beautifully:
“We don't chase blips anymore. We manage the system. That shift has made us more resilient and more consistent in our performance.”
And that shift wasn't limited to performance dashboards–it extended into leadership culture.
“This wasn't just a charting exercise–it's a leadership philosophy. It changed how we lead,” the CEO reflected.
Clarity Breeds Confidence–and Better Coaching
A system that reacts less doesn't mean a system that accepts mediocrity. It means we act with intention, not impulse. That's what this organization learned.
“Mark helped us not only build the technical skill, but also develop the confidence to coach our own teams. That's what sustains this work,” the VP of Process Excellence shared.
Leaders began using PBCs not just in executive meetings but on the front lines. They coached managers to interpret variation correctly, celebrate real improvement, and avoid demoralizing staff by overreacting to every dip in performance.
As the CEO told me:
“PBC thinking has transformed how we have conversations. There's more trust, more focus, and less drama.”
How I Can Help Your Organization Achieve the Same
Whether you're a CEO, VP, or manager, if you find yourself wondering whether a change in your metric is a real improvement or just a statistical fluke, you're not alone.
You don't need more data–you need better thinking.
I've worked with organizations large and small to build this capability. If you want to:
- Train your leaders in Process Behavior Charts
- Bring this thinking into your management system
- Transform your culture from reactive to proactive
…I can help.
How You Can Start
Whether you're a healthcare executive, a Lean leader, or a continuous improvement professional, here are a few ways to bring this thinking into your organization:
- Read the Book – My book, Measures of Success: React Less, Lead Better, Improve More, is a practical guide to understanding and using Process Behavior Charts.
- Try a Workshop – I offer both virtual and on-site workshops to train leaders and improvement teams on this approach. In just a few hours, you can see your metrics differently.
- Request a Coaching Engagement – Whether it's one-on-one leadership coaching or working with your performance improvement team, I help organizations apply this thinking directly to their context.
- Bring Me in for a Keynote – If you want to create a broader cultural shift, I offer keynotes that challenge assumptions and offer a new way forward for leading with data.
- Start Small – You don't need to overhaul everything at once. Choose one or two key metrics and begin charting them with this method. Share what you learn. Keep iterating and moving forward.
Get a free preview of the book here.
Final Thought: Data Shouldn't Divide Us
Too many organizations are doing the hard work of collecting data, only to be led astray by the wrong interpretation of that data. It doesn't have to be this way.
You can lead with confidence. You can improve with purpose. And your teams can stop reacting and start progressing.
If the story I've shared resonates with you, I'd love to help you write your own transformation story. Reach out. Let's build something better–together.
What do you think? Please scroll down (or click) to post a comment. Or please share the post with your thoughts on LinkedIn – and follow me or connect with me there.
Did you like this post? Make sure you don't miss a post or podcast — Subscribe to get notified about posts via email daily or weekly.
Check out my latest book, The Mistakes That Make Us: Cultivating a Culture of Learning and Innovation:


