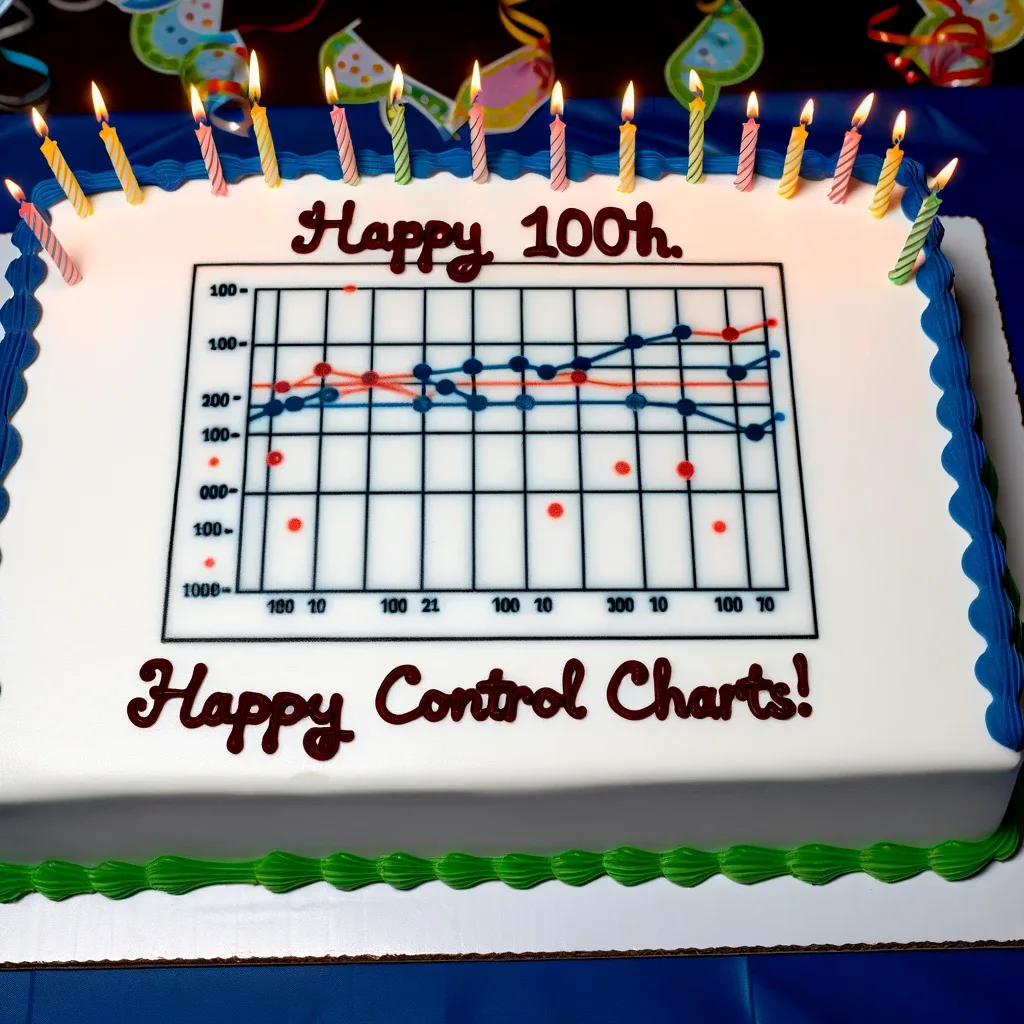
“A ‘special cause' for celebration.”
Brian Buck, on LinkedIn
TODAY marks the centennial of one of the most significant innovations in quality management: the control chart. 🎂 🎉 🎆
In the early 1920s, Walter A. Shewhart, working at Bell Labs, recognized the need for a statistical method to monitor and control manufacturing processes.
On May 16, 1924, Shewhart created the first “control chart,” a tool that distinguished between common cause variation (inherent in the process) and special cause variation (due to specific, identifiable factors). This simple yet powerful distinction laid the foundation for modern statistical process control (SPC). Control charts were dubbed “Process Behavior Charts” by Donald J. Wheeler Ph.D.)
The latest and greatest of the control charts is the “XmR Chart” — as Wheeler wrote about in Understanding Variation and I wrote about in Measures of Success (a book that has a foreword written by Wheeler).
The principles of control charts have been integral to various quality management frameworks, including Total Quality Management (TQM), Six Sigma, and Lean. Shewhart's work influenced notable figures like W. Edwards Deming, who further popularized the use of SPC in Japan and the United States post-World War II.
Art Smalley wrote a blog post about the use of SPC Charts at Toyota in the 1950s. Smalley claims that Toyota got their processes under such tight control that the charts were “essentially gone” by the 1980s. But he states also that the charts were automatically created:
“Control charts are now automatically generated and displayed as needed on a CRT type device or on an LCD screen. As was the case with Sakichi Toyoda's automatic looms the process today would signal when a defect occured and automatically stop the line (i.e. Jidoka concept).”
When I visited the Toyota plant in San Antonio about a decade ago, the tour guide (a regular team member on temporary assignment) said that Toyota taught everybody the “7 basic Q.I. tools” (including control charts). But the metrics I saw on display were line charts, not full-blown control charts with limits.
When I worked at General Motors from 1995 to 1997, control charts were maintained and updated by production workers in engine component machining areas, even if supervisors and managers didn't want to listen to what Wheeler calls “the voice of the process.” Management didn't want to stop production to investigate when things went “out of control” because the parts were still within specification limits… until they weren't. Management put quantity first and, of course, quality suffered. GM was not following the jidoka concept or practices.
Over the decades, control charts have evolved to accommodate different types of data and processes. Innovations such as the Individuals Chart (I-Chart), Moving Range Chart (MR-Chart), and more complex multivariate control charts have expanded their applicability.
The XmR chart, also known as the “Individuals Control Chart with a Moving Range,” was popularized by Donald J. Wheeler in his seminal work on statistical process control and process behavior charts. While the exact date of creation isn't specified, I think I remember Wheeler, in his in-person four-day workshop, mentioning that the XmR chart was created in the 1940s.
Yes, Wheeler's written history of the charts says it probably has origins going back to 1942 and it was first published in 1950 (not by Shewhart). Wheeler recalls he taught Dr. Deming about XmR charts in 1985. Understanding Variation was published in 1993.
Walter Shewhart's control charts have stood the test of time, proving to be an invaluable tool in the quest for quality and excellence. As we honor this centennial, we also look forward to the continued evolution and application of Shewhart's groundbreaking work, ensuring that quality remains at the forefront of organizational success for the next hundred years.
Here's a cake created by Chat GPT. Even though I uploaded a Process Behavior Chart, it didn't get the chart right at all. :-)

They are “old,” but they are not “outdated.” Let's celebrate and let's keep using Process Behavior Charts to make better decisions.
Added June 12, 2024: Don Wheeler's “Quality Digest” piece about the history of control charts:

You can download a PDF preview of my book Measures of Success.
See more blog posts about Process Behavior Charts or via this link to posts tagged as PBC content.

Please scroll down (or click) to post a comment. Connect with me on LinkedIn.
Let’s build a culture of continuous improvement and psychological safety—together. If you're a leader aiming for lasting change (not just more projects), I help organizations:
- Engage people at all levels in sustainable improvement
- Shift from fear of mistakes to learning from them
- Apply Lean thinking in practical, people-centered ways
Interested in coaching or a keynote talk? Let’s talk.
Join me for a Lean Healthcare Accelerator Trip to Japan! Learn More


