“Red / Amber / Green” Charts Are Neither State of the Art Nor Effective Visual Management
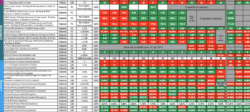
In my book Measures of Success: React Less, Lead Better, Improve More, I try to make the case that “Process Behavior Charts” are a better technology than tables of color coded numbers. These tables of numbers are often referred to as “bowling charts.” They are often taught as a method in Lean classes or workshops. But, they are problematic. Here is an example of such a chart / table from my book: Can you really … Continue reading “Red / Amber / Green” Charts Are Neither State of the Art Nor Effective Visual Management
3 Comments
