Reminder: I'm doing a free mini-workshop in Austin tonight if you're in the area. There's still time to sign up. More info can be found here.
This session is a dry run for a “lunch and learn” session that I'll be doing at Lean Startup Week this November. I'll be facilitating the “Red Bead Experiment” that was made famous by the late, great W. Edwards Deming and I'll be a main stage speaker.
I'm sure some at Lean Startup Week will wonder about the relevance of a famed quality guru who passed away almost 25 years ago.
Thankfully, Eric Ries sees the relevance and cited Dr. Deming a few times in his first book The Lean Startup. I'll be recording a podcast in a few weeks with Eric about his upcoming book (which is excellent, based on the early copy I received), The Startup Way.
Update: Here is that podcast with Eric
In The Lean Startup, Eric wrote:
Why are we doing something different?
It is these questions that require the use of theory to answer. Those who look to adopt the Lean Startup as a defined set of steps or tactics will not succeed. I had to learn this the hard way. In a startup situation, things constantly go wrong.
When that happens, we face the age-old dilemma summarized by Deming: How do we know that the problem is due to a special cause versus a systemic cause?
If we're in the middle of adopting a new way of working, the temptation will always be to blame the new system for the problems that arise. Sometimes that tendency is correct, sometimes not. Learning to tell the difference requires theory. You have to be able to predict the outcome of the changes you make to tell if the problems that result are really problems.
Ries, Eric. The Lean Startup: How Today's Entrepreneurs Use Continuous Innovation to Create Radically Successful Businesses (p. 270). The Crown Publishing Group. Kindle Edition.
To me, the lessons of the Red Bead experiment (as I'll facilitate and also talk about in a short main stage session) tie into the idea of not wasting people's time. I'll explain more about that in a bit.
As Eric wrote about in The Lean Startup (and as many others say), time is the most precious commodity anybody has. I think that's true in startups and it's true in other organizations. Everybody says they don't have enough time. So, we have to use it wisely.
Eric makes a great point that a startup shouldn't ask developers to spend years working on a product that nobody ends up buying. The same is probably true with big company product development efforts (which is more of the focus of the upcomingThe Startup Way book).
Not wasting time and talent reminds of what's sometimes called “the 8th waste” in the context of Lean — the waste of talent or the waste of human potential.
One way we reduce the risk of wasting people's lives is by TESTING ideas early and often. Deming would have called these PDCA or PDSA cycles. I prefer saying “Plan Do Study Adjust.” Developing a product or service (or a startup) is an iterative process where we learn and improve based on feedback. Eric called this the “Build-Measure-Learn” cycles… it's the same idea.
The very last words of The Lean Startup asked:
“If we stopped wasting people's time, what would they do with it?”
So how does the Red Bead experiment relate to not wasting time?
The Red Bead experiment makes it painfully apparent that there's going to be variation in the performance of any system, even if we have a consistent process where people do work the same way.
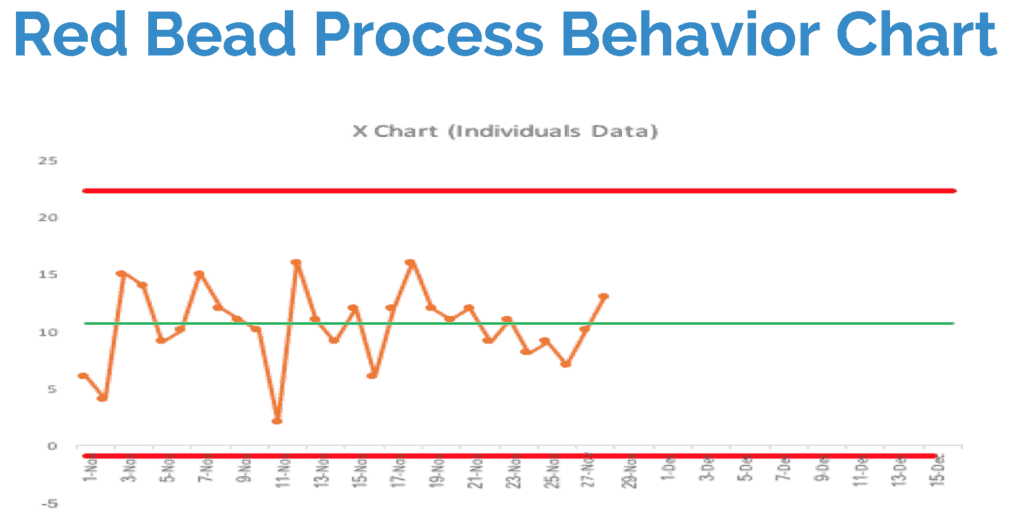
When we draw what Don Wheeler calls a “process behavior chart,” we can see the “noise” in the data. When we chart the number of red beads (defects) drawn in each round of the experiment by each person, we see variation… it's all “common cause” variation. Each data point is likely due to chance (because, in the experiment, it IS chance):

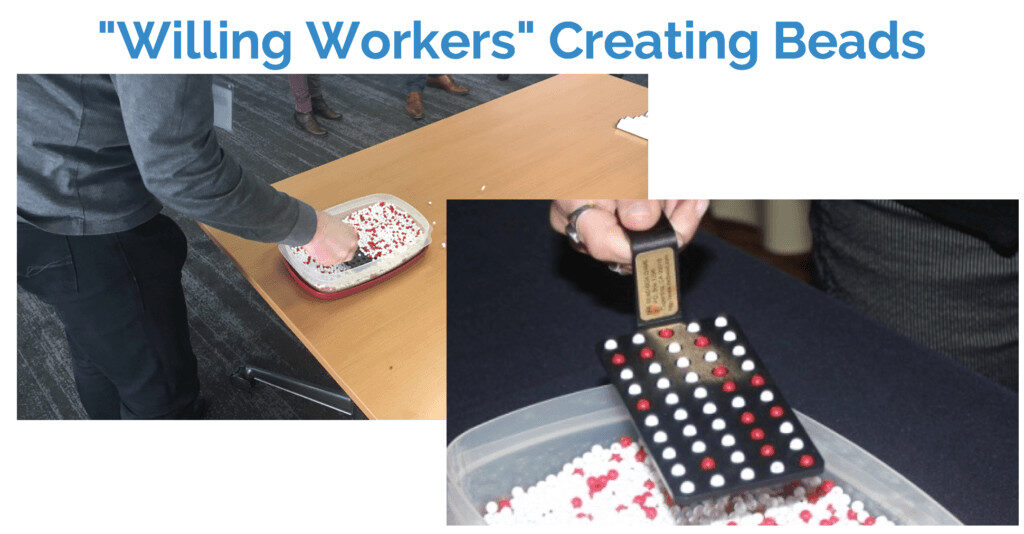
The average is about 10 red beads per paddle – to be expected, since the paddle has 50 holes and about 20% of the beads in the box are red, as shown below.
Each of those data points in the chart is “in control.” It's a “stable and predictable system,” the “production” of red beads. We can calculate “control limits” (aka “process behavior limits”) based on the inherent calculated common cause variation from point to point (learn more about how to do this).
Reminder: The limits are calculated. They are not the target and they're not arbitrary or what we want them to be. They are from the data that is the “voice of the process.”
Because it's a stable and predictable system, we can predict with pretty good certainly that the next draw of beads will produce between zero and 22 beads. Anything in that range is noise and is most likely explained by randomness or chance.

We waste people's time when we ask them (or demand them) to come up with an explanation for the noise. If a manager is asking “what went wrong yesterday?” in a stable and predictable system, that's the wrong question. That question is a waste of time.
Trying to answer that question leads to a lot of wasted time. Don Wheeler talks about “writing fiction” or coming up with a plausible reason that makes our boss happy. But that doesn't lead to improvement.
We need to be asking, “How do we improve the system?” to reduce the mean and/or reduce variation in the output of a process.
I helped KaiNexus use these practical lessons in a way that stopped wasting some of our marketing director's time.
Our CEO often looked at a chart, updated weekly by the marketing director, that showed things like the number of “marketing qualified leads” that we had each week.
The CEO, as many leaders do, would ask the marketing director to explain weeks when the number of MQLs had dropped or weeks when the number was below average.
When we created a “process behavior chart,” we saw that the number of MQLs was a stable and predictable system. It was “in control.” Ideally, you would want that number to be increasing, so you could do a process behavior chart for the slope of the line, plotting the weekly INCREASE in leads (which could be a negative number).
The number of MQLs was stable and flat. It fluctuated around a mean, like we see in the Red Bed chart. Some weeks are going to be higher than others due to a number of factors… that's the noise in the system. Roughly half of the weeks were below average, which shouldn't be a surprise.
When I coached our CEO to stop asking for a “special cause” explanation for common cause variation, it was a relief to the marketing director. She felt like it wasn't a good use of time cooking up a simple explanation for that common cause variation.
Her time is better spent figuring out how to improve the system, how to improve the average, instead of writing fictional explanations for special causes that don't exist.
An hour saved on fictional explanations is an hour that can be spent generating more content for our blog or doing other things that would increase website traffic. Our marketing director's time is better spent being creative in creating content instead of being creative in coming up with explanations for every up and down in the data.
The same idea seems to apply to many of the charts and metrics that a startup (or a corporate “intrapreneurship” process) might have.
- Number of leads each day/week
- % of leads that convert to customers
- Customer Acquisition Cost for new customers
- Number of software bugs per developer
- % of support tickets closed in X hours
Having close to real-time metrics is a good thing. That's one way we gauge our progress. But, more data creates the risk of MORE wasted time. If we're cooking up a fictional explanation instead of weekly, that's a big loss to the organization.
Stop wasting people's time. We'll be more successful as a result.
As Eric wrote in The Lean Startup, just before his final words:
“We would achieve speed by bypassing the excess work that does not lead to learning.”
Some of this “excess work” includes over explaining every up and down in the data. We need to look for “signals” in our data instead of overreacting to the “noise.”
That's one thing I cover in more detail in my “Better Metrics” workshop. We create Process Behavior Charts from data that people bring and we learn how to properly analyze them… how and when to react to signals instead of noise. I'm running this full-day workshop Wednesday at our KaiNexus User Conference.
I'm curious to hear your reactions, especially if you work in a startup. What are your “red beads?” Do you overreact to every up and down in your data? Does this seem like a waste of time that can be avoided if we learn better methods for managing our metrics?
Eric and the Lean Startup movement talk a lot about WHAT metrics to choose. We need to avoid fixating on “vanity metrics.”
As he writes in The Startup Way:
“The fact that your site has seen an uptick in visitors doesn't mean your product is more popular or you're more successful. “
We need to choose the RIGHT metrics AND evaluate the metrics in the RIGHT way over time.
I'd extend Eric's point to also say:
“The fact that your site has seen an uptick in visitors doesn't mean your site is getting more visitors.”
That “uptick” might be noise in the data, not a meaningful signal.
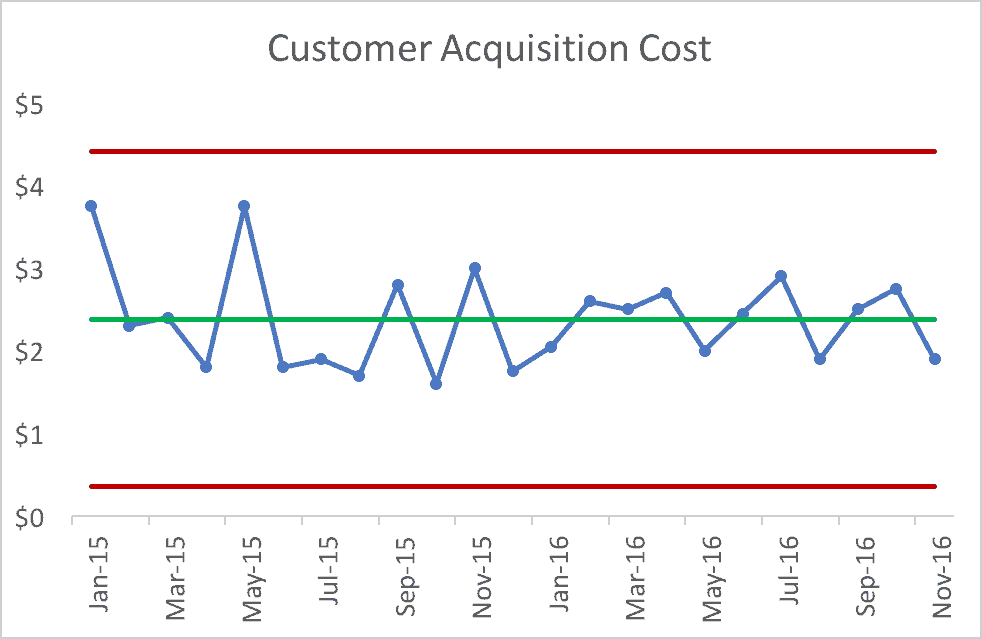
This next chart is all noise – any uptick or downtick doesn't have a single reason. We can't do a simple “5 whys” exercise to explain it.

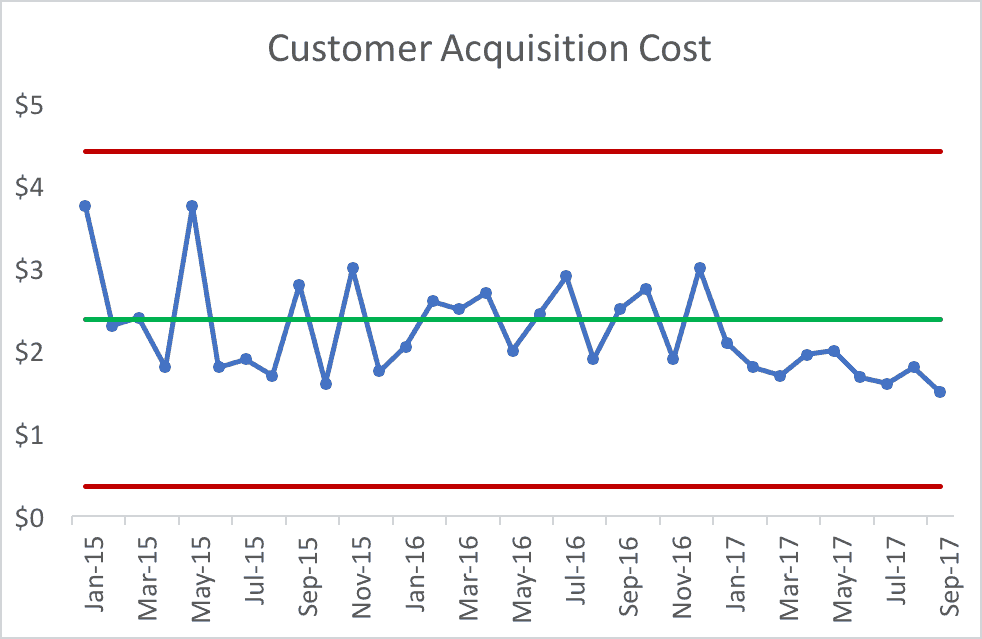
This next chart DOES have a signal.
There are, thankfully, some rules that help us determine if there's a signal in the data. it's not hard to do.

This particular signal is having eight or more consecutive points below the established average. That's unlikely to occur by chance. In the Red Bead experiment, if we had eight draws in a row with fewer than 10 red beads, you might suspect people are cheating.
Now, when we have a signal, we can and SHOULD ask “why did the system improve?” This shift could confirm that some experiment we did had positive results. Or, it might have “just happened,” so if we don't go understand why, we lose the learning and we might not be able to “lock in” that new level of performance.
Thanks for your feedback on these ideas… this will allow me to tighten up and better tailor message for a brief 15 minutes on stage at Lean Startup Week.
Please scroll down (or click) to post a comment. Connect with me on LinkedIn.
Let’s build a culture of continuous improvement and psychological safety—together. If you're a leader aiming for lasting change (not just more projects), I help organizations:
- Engage people at all levels in sustainable improvement
- Shift from fear of mistakes to learning from them
- Apply Lean thinking in practical, people-centered ways
Interested in coaching or a keynote talk? Let’s talk.
Join me for a Lean Healthcare Accelerator Trip to Japan! Learn More


