As I've done before (and written about), I'll be facilitating the famed “Deming Red Bead Experiment” on Thursday at the Society for Health Systems annual conference. See this pages with notes and slides.
The intent of the exercise is to help people see and understand common cause variation in a system. Different participants dip their paddle in the bucket and get, normally, anywhere from 6 to 14 red beads, with those beads represent defects.
In the exercise, the facilitator (as supervisor) praises those who do better than average and threatens those who “underperform” with punishment.
Since there are 20% red beads in the bucket, it's statistically expected that each dip of the paddle will result in 10 red beads out of 50. Sometimes more, sometimes less.
One point that I've made well through the simulation is to NOT overreact to every above average or below average point… don't overreact to every up and down in the system.
When we create an SPC chart of the red beads drawn by the different participants, we can see that this is pretty much the definition of a “stable system.”
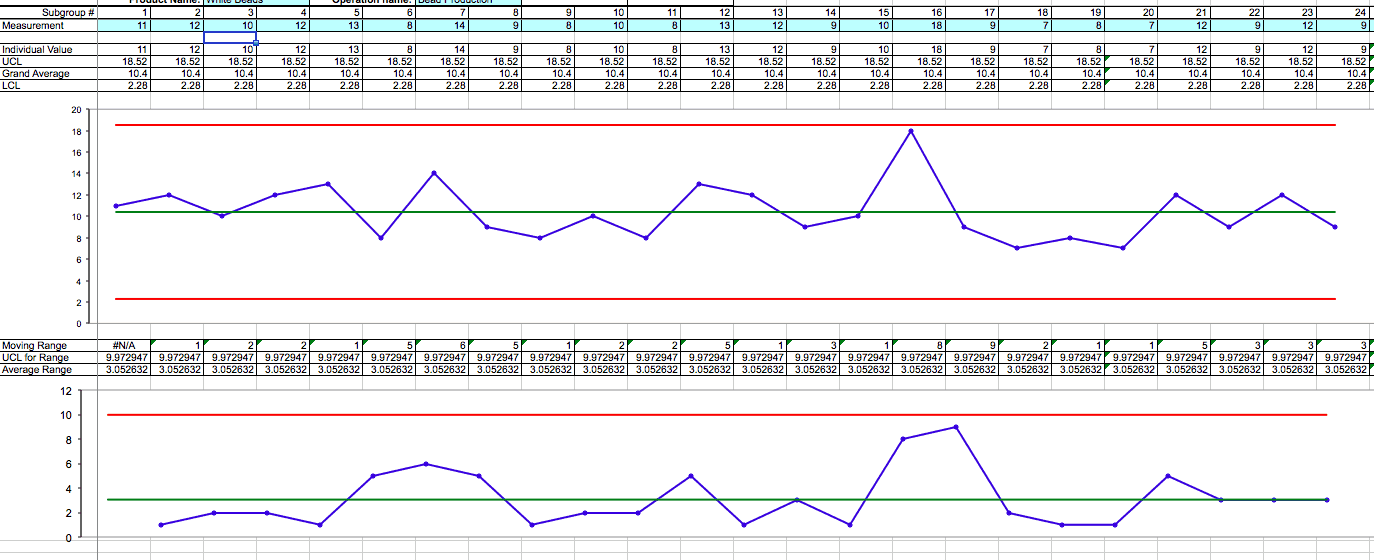
When it's a stable system, the good news is that we can predict, with pretty good certainty, that the number of red beads drawn next will be between about 2 and 19. The bad news is:
- Half of the time, we'll do worse than the average of 10
- Almost always, we'll perform worse than an arbitrary goal of 3
It's easy to say that, in a stable system, we shouldn't go looking for “special causes” that probably aren't there. Looking at the SPC chart, there was one time when a person had 18 red beads. That's far worse than average and it was the worse round of the game.
The Wrong Question and the Better Question
The WRONG question to ask would be:
“What went wrong that day?”
It's the wrong question because there was nothing different that day. It was the same system. There was no change in the system to correct or diagnose.
But, organizations do this all of the time. I visit hospitals and hear managers complain about being asked to explain a day's productivity number that was just slightly higher than average. See this post for examples of an organization overreacting to every time a chart is above or below some arbitrary line: “What's Demoralizing? The Colors on a Chart or Not Improving the System?“
Looking for these explanations WASTES a lot of time… unless the SPC chart tells us there is likely a special cause. In the Red Bead game, a person who got zero or one red beads (or 20) probably cheated and distorted the system by hand placing beads instead of dipping the paddle.
What should SHOULD we ask when we have a stable system that's not meeting it's goal? A better question is:
“What can we do to improve the system?”
That's usually a better question than “why did we have a bad day?” Time spent chasing (or making up) answers to “what went bad yesterday?” distract us from understanding and improving the system.
If our emergency department wait times are stable, but not meeting customer needs or our goals… what are you going to do to improve the system? You can't just post metrics and pressure people to get better. You need to take action, such as changing the triage process or using better visual signals to communication between functions. You have to improve the system.
Improving a Stable System
Let's say you're trying to lose weight (my “Lean Health” podcast with Paul Akers is good to listen to on this topic and I've lost 8 pounds this year following some of his advice).
Before I started losing weight, If I were measuring myself every day, at the same time each morning, my weight might look like a stable system. Some days, your weight is going to be higher than others for a number of reasons, and some days you'll regress back to the mean.
Let's say I had an average weight of 198 pounds. My goal is more like 185.
Some days I would be 197.2 and some days 199.4. A single day at 199.4 is probably not an indicator that I'm “gaining weight.” Two data points don't make a trend.
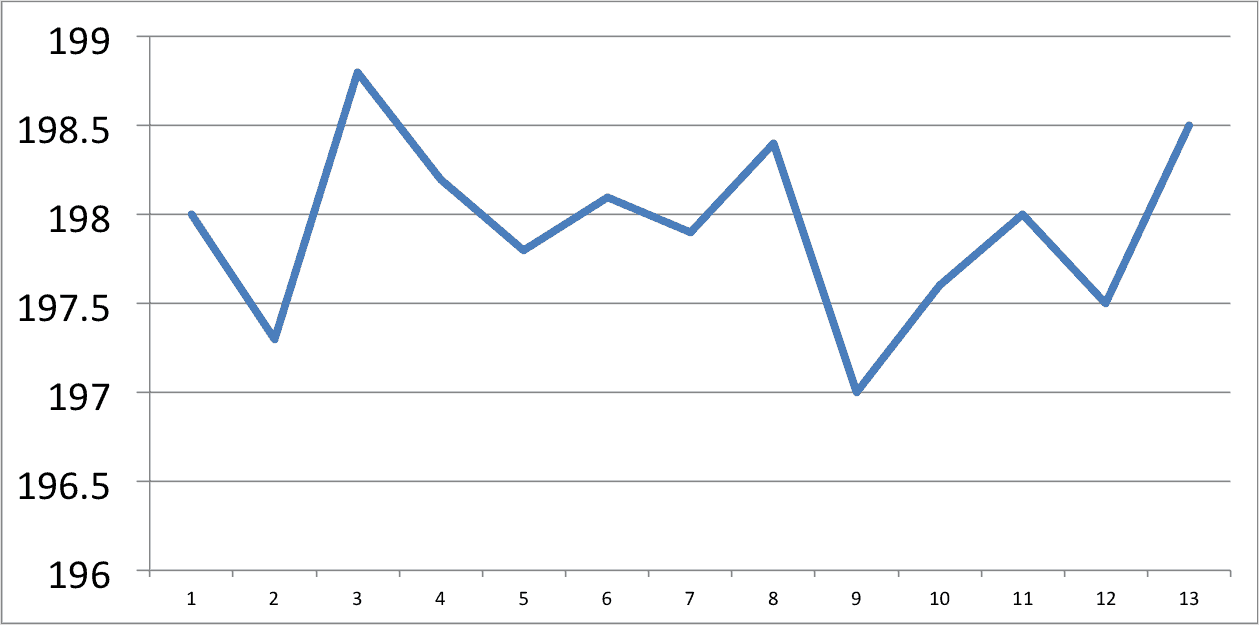
That one data point at 197 apparently didn't mean I was “losing weight,” either.
I had a weight that was higher than my goal, shown in the red line:
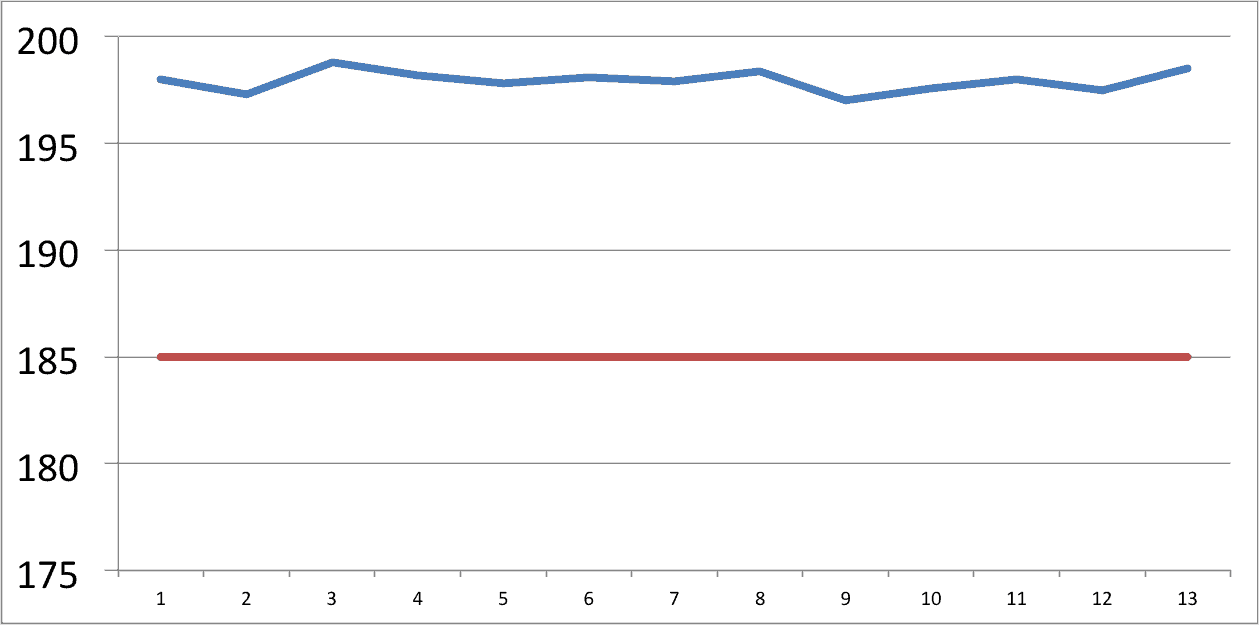
When my weight was at 197 for a day, maybe I had changed my system and ate better than normal… but I hadn't really sustained any sort of system change because the number went right back up. Maybe I was just dehydrated that day.
To improve a stable system, we have to CHANGE the system.
In the Red Bead game, you could shut down production and sort out the red beads. You could change suppliers. Firing the workers and replacing them doesn't change the system (which makes me think about hospitals and their reaction to errors and harm… does firing an individual improve the broken system?).
In the case of weight loss, I took a few actions to try to change my system.
I had been exercising, but I had slacked off a bit in the second half of 2015.
I've never “counted calories” before. But, at Paul's urging, I started using the free “My Fitness Pal” app to track calories. Even if I tried to eat “healthy” or “low carb,” I was pretty oblivious to the number of calories I was consuming each day.
The app set a calorie goal that would help me lose 1 to 2 pounds per week (a pretty sustainable pace). The app helped me better understand good choices versus bad food choices and to better manage my calories. I started walking a bit more and hitting the gym a little more, but the biggest systemic change was diet.
Here's my weight since January 1 when I was at 200 pounds:
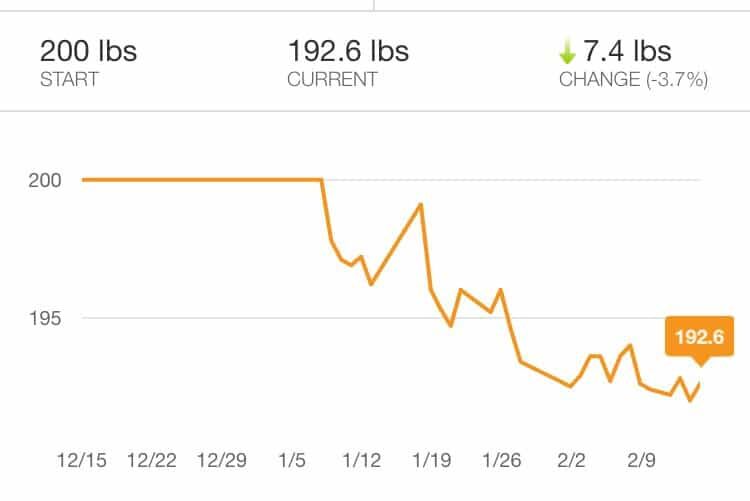
I've hit 192 and have maybe “plateaued” a bit. I can be a little more disciplined about what I eat (and drink). I know what needs to be done to continue losing weight… I have to just continue doing it. Even with a fairly steady downward slope, there's still daily variation around that trend. It's good to see the chart and to understand that variation… so I can not overreact to it.
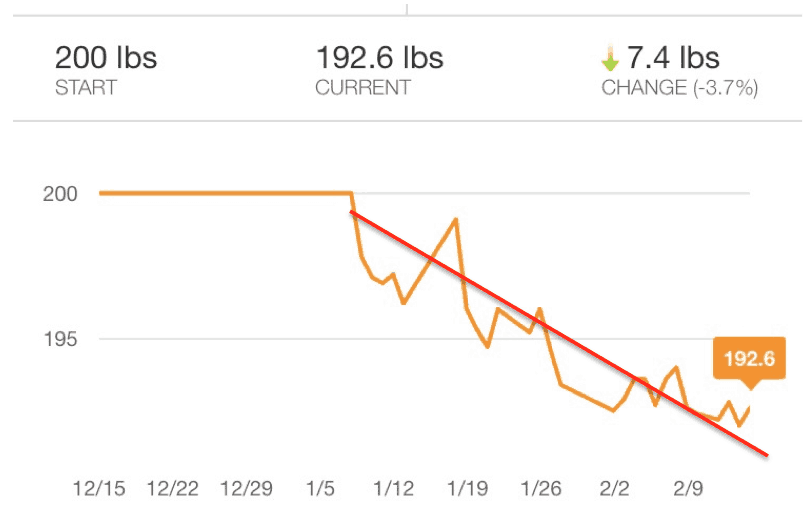
I'm improving my stable system. I can anticipate when I might hit 185 (and the app helps project that). I hope to get my weight down and sustain that new stable system. I wrote this yesterday and, today, I was at 191.6 as the red light would have predicted.
But, it required more than asking, “Why is my weight higher today?”
What are the lessons that you can apply to your own workplace? How can you improve your systems instead of just chasing every data point?
Please scroll down (or click) to post a comment. Connect with me on LinkedIn.
Let’s build a culture of continuous improvement and psychological safety—together. If you're a leader aiming for lasting change (not just more projects), I help organizations:
- Engage people at all levels in sustainable improvement
- Shift from fear of mistakes to learning from them
- Apply Lean thinking in practical, people-centered ways
Interested in coaching or a keynote talk? Let’s talk.
Join me for a Lean Healthcare Accelerator Trip to Japan! Learn More


I’ve done the Red Bead Experiment a handful of times with an emphasis on the leadership and their expectations. It has helped our organization’s leaders (particularly the new/younger ones) see that the system drives the results, and that improvements must be made to the system to see significant improvement.
Great post, Mark! I wish I’d known about the Red Bead Experiment earlier as the hospitals / health systems I’ve worked for could have really benefitted from deeper understanding of normal variation. I would often talk about it in kaizen workshops or when discussing other improvement opportunities, but a demo like this would have made the point easier to understand. I’d love to see the experiment sometime!
I like the parallel with your personal goal. I’ve had a similar tracking tool (a scale that transmits to the cloud). We bought it right before my first pregnancy. It’s fun to look at the trends for each pregnancy and my slow creep back to norm (or rather, the new norm). Keep up the good work with the weight loss!
Mark thanks for this post and explanation of stable systems and special cause variation. I’ve read a lot about the red bead experiment and saw you lead it at a NE Shingo conference few months ago.
We are challenged by this exact issue at my hospital. A few leaders have responded to some performance improvement areas but going around putting up metrics without thinking about how we can improve the processes.
Your post gives me some great things to think about as I work to coach and support our leaders.
Regards,
Keith
Comments are closed.